Dose-response data evaluation
drfit-package.RdSee ../DESCRIPTION
Details
There is an introductory article located in ../doc/drfit-Rnews.pdf, which will be published in the R News special edition on the use of R for chemists.
Note
There is a demo for each dataset that can be accessed by
demo(dataset)
See also
On CRAN, there is another, more statistically sophisticated package with
similar functionality called drc. I think the advantage of my package
is its user-friendliness.
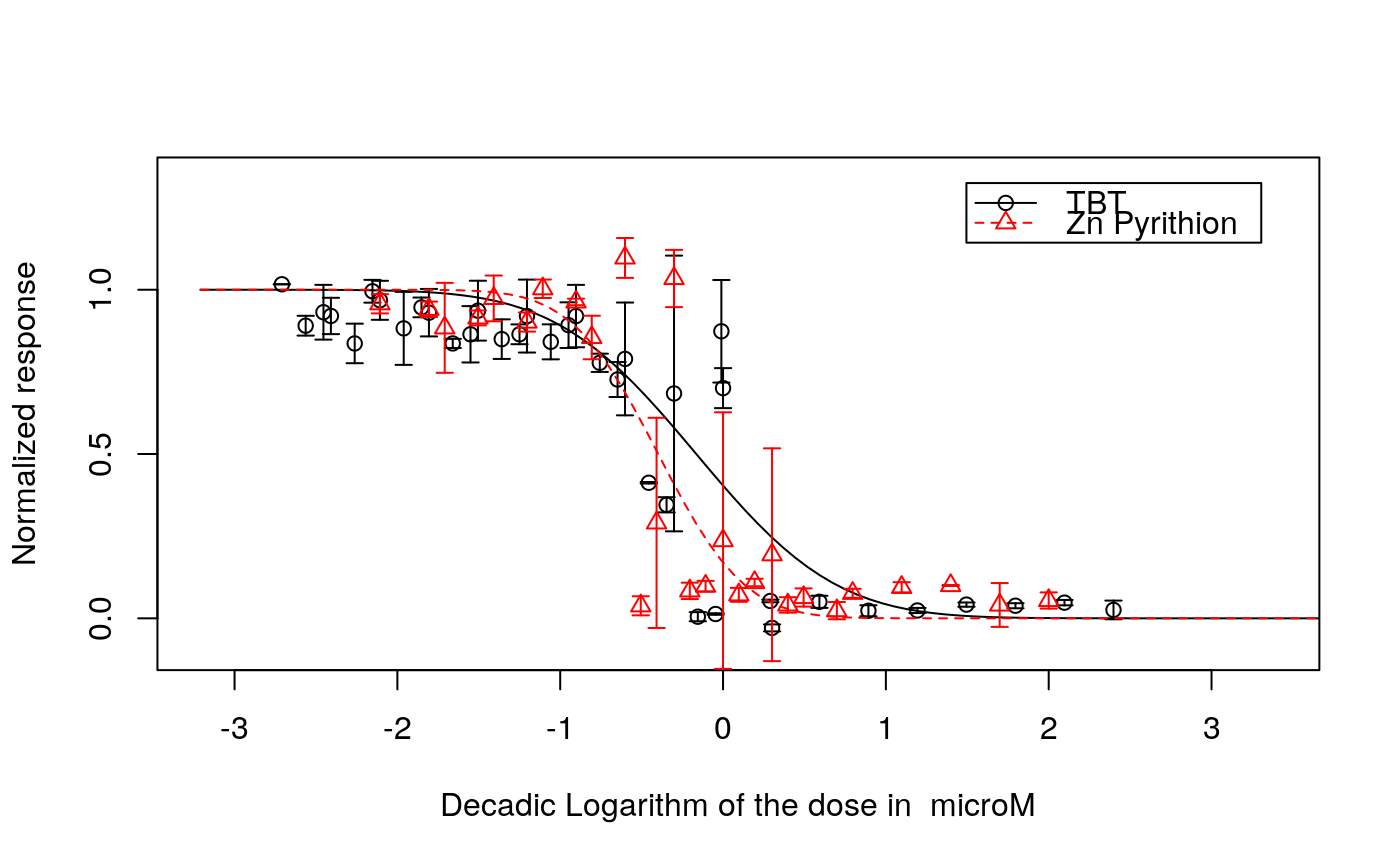
Examples
#> #>#>#> #>#>#> Substance ndl n lld lhd mtype logED50 2.5% 97.5% unit sigma a #> 1 TBT 38 135 -2.7 2.4 probit -0.16 -0.27 -0.056 microM 0.19 -0.16 #> 2 Zn Pyrithion 27 81 -2.1 2.0 probit -0.40 -0.51 -0.292 microM 0.23 -0.40 #> b #> 1 0.68 #> 2 0.42